

2026 Annual Sustainability Report
Use the buttons below to navigate between sections or return to report home.
Clean & Affordable Transportation
City Objective: Create an integrated, multi-modal transportation system that serves all users safely, efficiently, and affordably while minimizing greenhouse gas pollution.
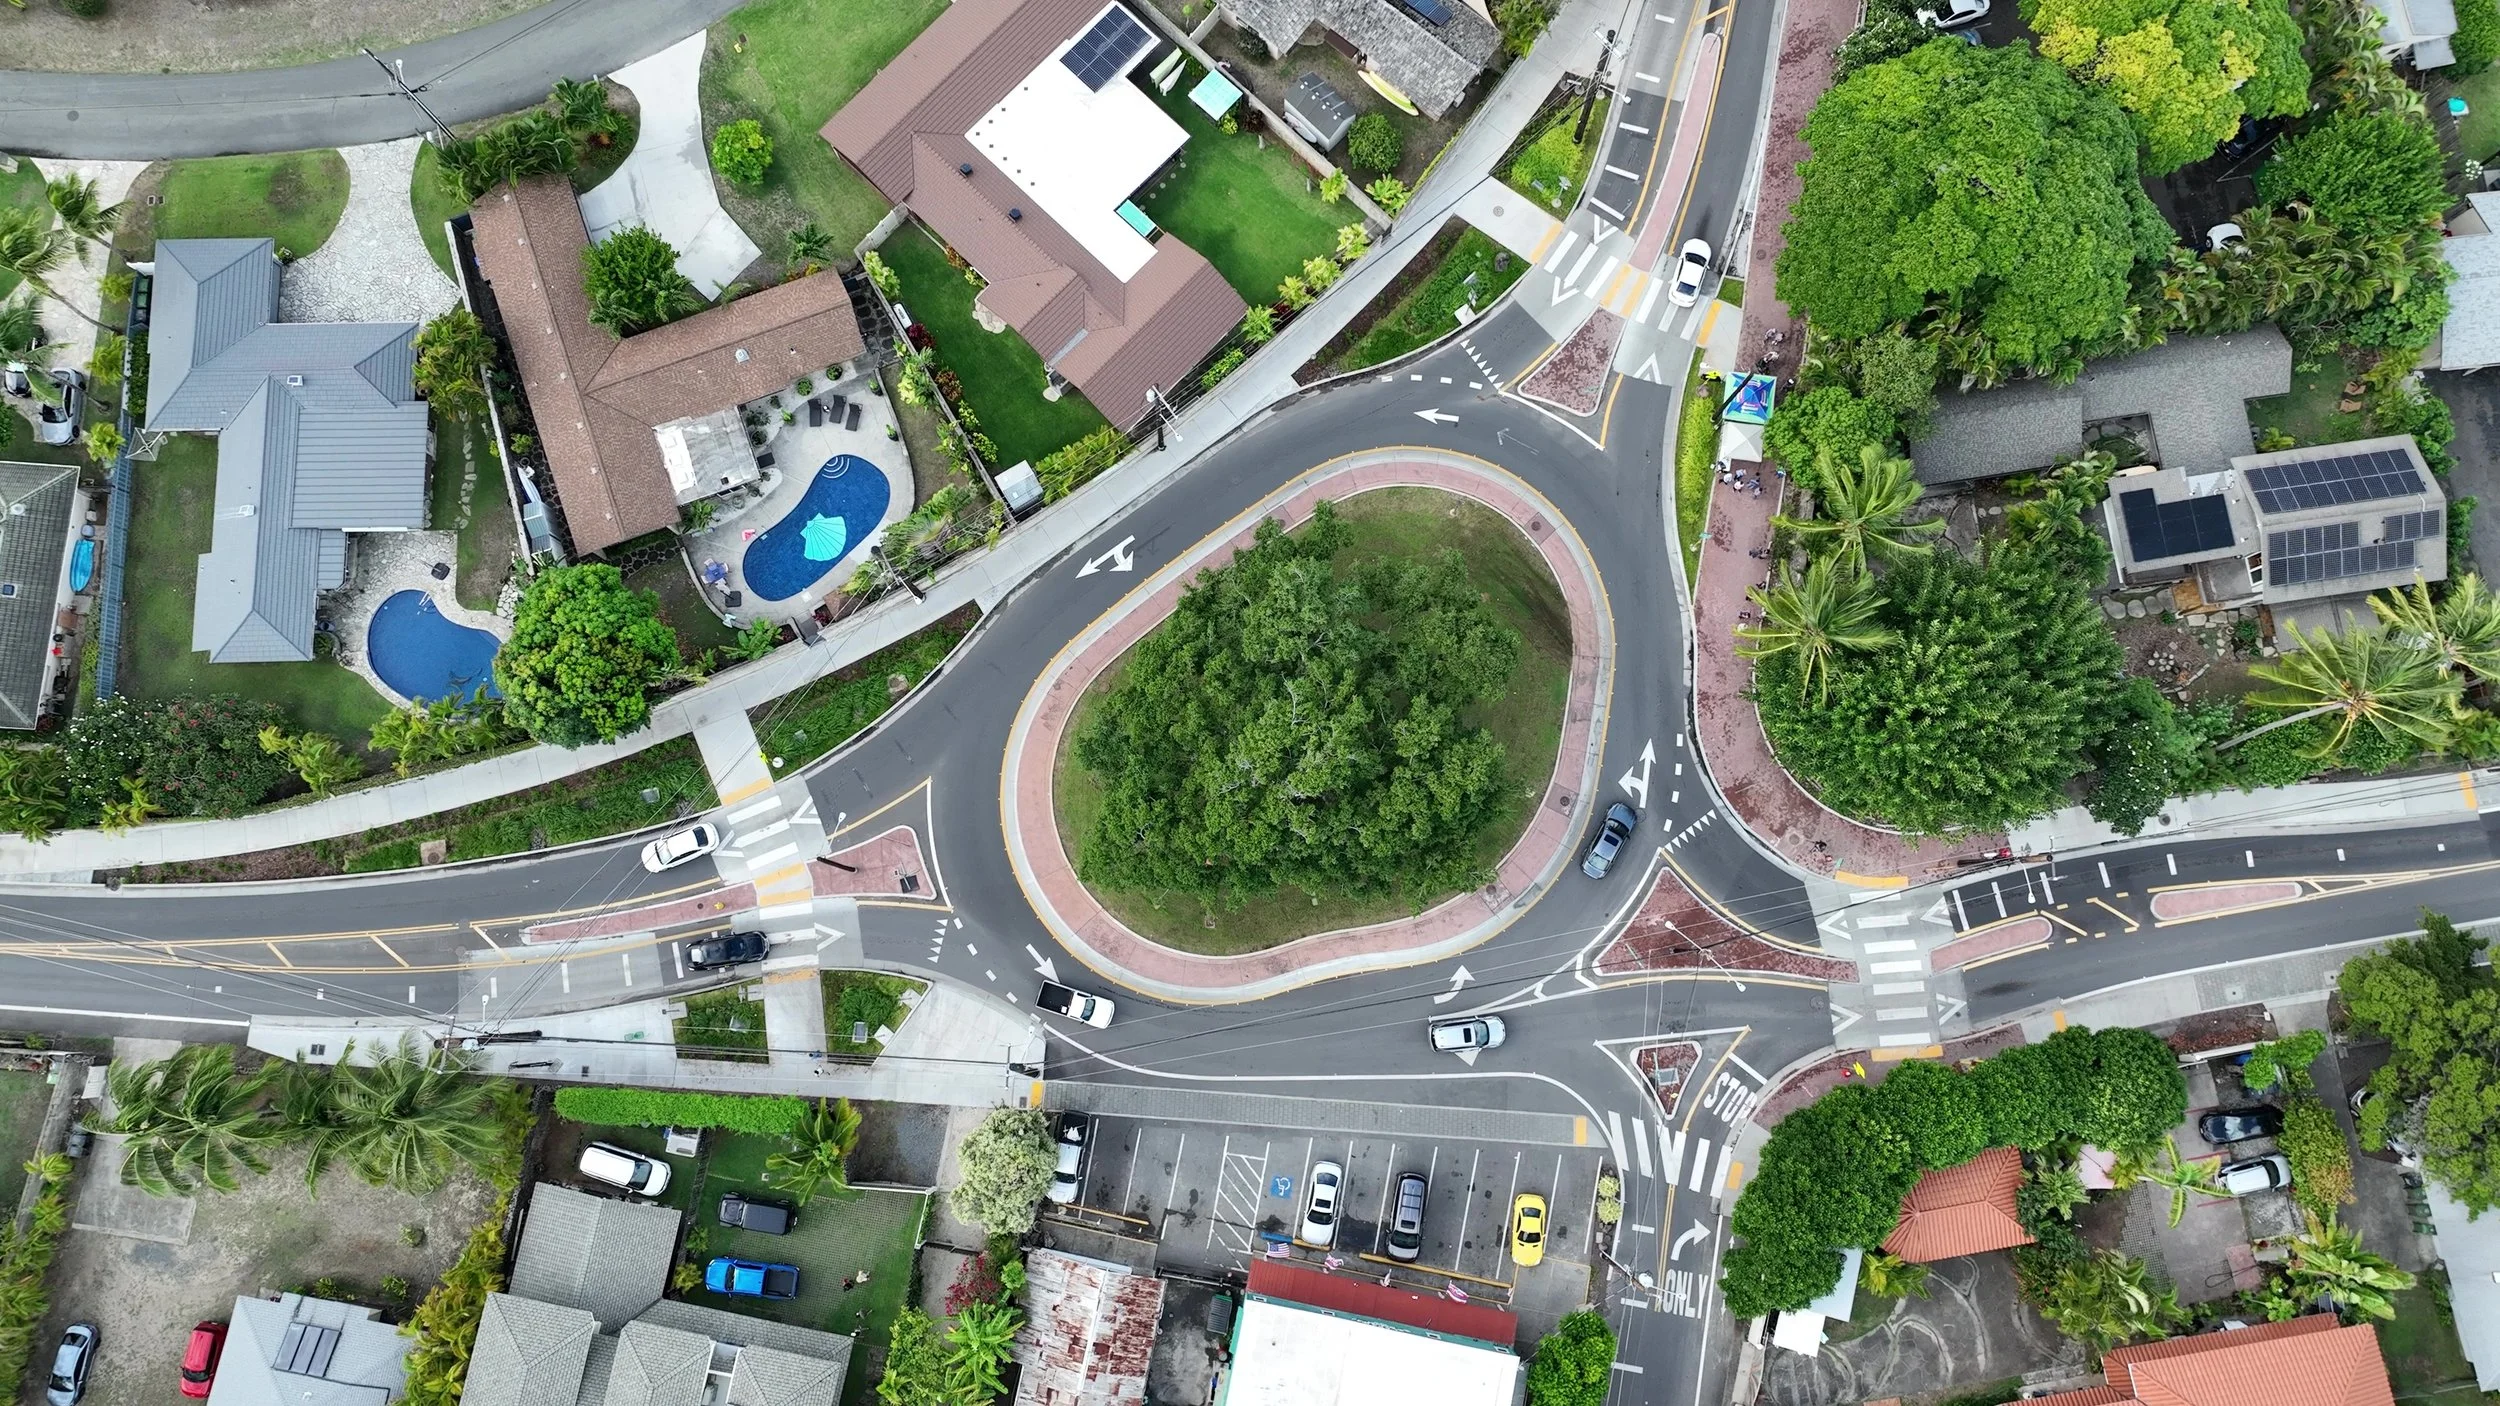
◀️ In November 2025, the City celebrated the completion of the Kalapawai Roundabout in Kailua. The modern roundabout design improves traffic flow, enhances safety for pedestrians and bicyclists, and protects local waterways through stormwater drainage solutions.
Credit: Department of Transportation Services
The City marked a major transportation milestone in 2025 with the opening of Skyline Segment 2 from Aloha Stadium to Kahauiki (Kalihi Transit Center)!
The new segment adds five additional miles and four new stations, extending Skyline service to key employment locations, the airport, and additional transit connections. Contributing to weekday ridership records set just a few months into segment activation, this expansion strengthens affordable, safe, reliable transportation options and supports the City’s vision of a low-carbon transportation future.
Additionally, new active transportation initiatives have expanded options for people to bike, walk, and roll. New protected bike lanes installed last year in the urban Honolulu core give commuters a safer way to travel without worrying about parking or traffic congestion. The City also completed renovations of a segment of the Pearl Harbor Historic Trail bike path, better linking neighborhoods, improving access to Skyline, and providing bicyclists with a smoother, safer ride.
These efforts contributed to the City’s recognition as a “Silver Status” Bicycle Friendly Community by the League of American Bicyclists in 2025.
Improving safety remains a critical priority for the City’s transportation system, particularly in response to recent increases in traffic fatalities. In 2025, the City adopted the final Oʻahu Vision Zero Action Plan, creating a roadmap to eliminate traffic deaths and serious injuries while improving equitable transportation choices for all users. The City also strengthened e-bike safety through Ordinance 25-6, supporting the responsible use of e-bikes as an affordable, convenient, and cleaner way to get around.
Key Performance Indicators
Traffic Fatalities
Number of Traffic-Related Deaths per Year, by Type
Complete Streets Projects
Locations of Complete Streets Project Installations on O‘ahu, by Project Type
Commute Mode Share
Percent Share of Commuters by Mode of Transportation
Vehicle Miles Traveled
Annual Vehicle Miles Traveled (VMT) per Vehicle and per Capita
Transportation Cost Burdens
Percent Share of Household Expenses Spent on Transportation Costs
TheBus Ridership
Number of Trips Taken on TheBus per Year
Skyline Ridership
Number of Monthly Trips Taken on Skyline per Year
Biki Ridership
Number of Trips Taken on Biki Bikeshare per Year
Bicycle Facilities
Number of New Bike facility Lane Miles Added per Year, by Facility Type
Electric Vehicle Registrations
Number of New Electric Vehicle (EV) Registrations per Year, by Vehicle Type
Electric Vehicle Chargers
Locations of Electric Vehicle (EV) Chargers on O‘ahu, by Charger Type